This is Part 2 of a series on Grant Thornton’s global research for H2 2020. To read Part 1, which introduces the report and provides a framework for interpreting the data, click here.
H2 2020 brought significant improvements in business confidence around the world, according to Grant Thornton’s global research. The change includes a 14% rise in global business confidence over the corresponding H1 2020 totals, alongside double-digit increases in several related categories. Survey respondents from across the business world likewise indicated their intention to increase investment across multiple areas over the next 12 months.
A pair of important caveats are worth highlighting in the context of these findings, however. The first is that the increases represent comparisons only to H1 2020, a historical outlier due to the immediate fallout from the COVID-19 pandemic. All of the aforementioned survey results remain beneath H2 2019 levels. Another element of caution is also warranted when interpreting the research – namely that while the new numbers indicate positive developments over the first half of the year, they also accompany decidedly mixed responses on important business constraints that could limit private sector growth.
Turning the corner – in some areas
Grant Thornton’s global research includes survey responses from more than 10,000 mid-market businesses across 29 economies worldwide. Key statistics from the H2 2020 report include the following:*
- Global business confidence stands at 57% – an increase of 14 ppts from H1 2020 (but a decline of 2% compared to H2 2019).
- Positive revenue expectations stand at 45% – an increase of 11% from H1 2020 (but a decline of 9% compared to H2 2019).
- Positive export expectations stand at 34% – an increase of 9% from H1 2020 (but a decline of 2% compared to H2 2019).
- Positive employment expectations stand at 38% – an increase of 10% from H1 2020 (but a decline of 7% compared to H2 2019).
- Positive profitability expectations stand at 44% – an increase of 12% from H1 2020 (but a decline of 10% compared to H2 2019).
* N.B.: On each question, the questionnaire gives respondents a binary choice, usually asking them to predict an increase or decrease in outcomes over the coming 12 months. Numbers represent the percent of positive responses, after negative responses are subtracted. For example, if 70% of respondents give a positive response to a question, and 30% give a negative response to the same question, the number listed here will be 40%.
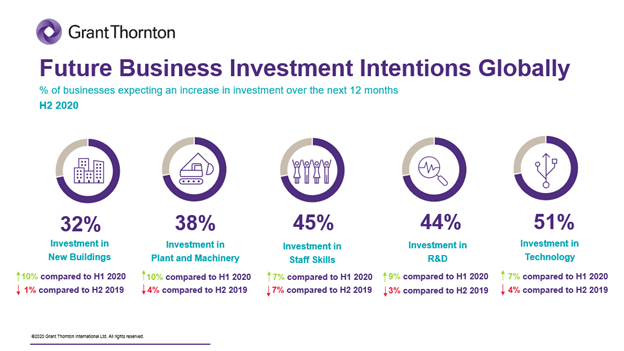
Similar patterns are evident in the data on expected investment over the next 12 months, which likewise represent an increase from H1 2020 estimates. See the chart below for details:
![imagedtg5.png]()
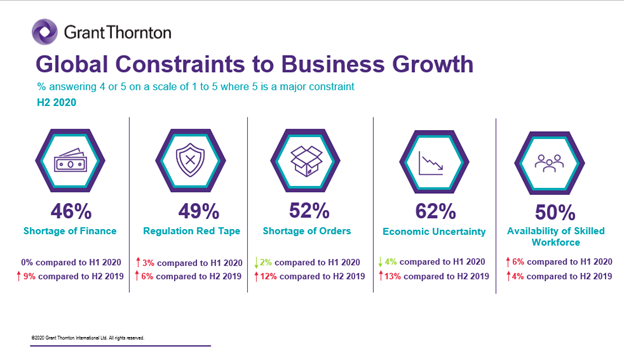
These numbers once again highlight relatively modest levels of optimism – essentially what might be expected from a global economy that is beginning to recover from its lowest ebb. More fascinating is the following data set, which indicates that the major constraints limiting business growth are expected to remain largely in place even as companies prepare for better performance and increased investment. See for yourself in the following data:*
![imageudx7c.png]()
* In the above chart, expected improvements are marked by down-arrows, as we are measuring the impact of business constraints.
Learning to make lemonade
How shall we understand the apparent contradiction in the data? On one hand, businesses worldwide expect to see better outcomes over the next 12 months – but at the same time, they don’t anticipate much overall difference in the challenges they will face.
Analysing these numbers in detail, the most compelling explanation is that their experience during the pandemic has taught companies to do more with less. It’s worth bearing in mind that these survey responses were delivered during one of the most severe periods of the pandemic, and before vaccines had begun to roll out anywhere in the world.
These improved estimates follow a period of increased digitalisation for many businesses, and accelerated movement towards agile business models. As we’ve discussed elsewhere, the embrace of agility helps organisations follow the upper arm of the ‘K’-shaped recovery that many business analysts predict will characterise economic growth in the post-pandemic period.
Other notable adaptations include the rebalancing of investment priorities towards more traditional categories, and the prioritisation of international sales and supply chains ahead of domestic markets. The details vary by region (and by company), but the flexibility to make these types of choices has allowed businesses to – as the saying goes – turn lemons into lemonade.
Part 3 of this series, covering the APAC region, will follow shortly.